"Something Very Strange Has Happened": Albert Edwards Stunned By "The Maddest Macro Chart I Have Seen In Many Years"
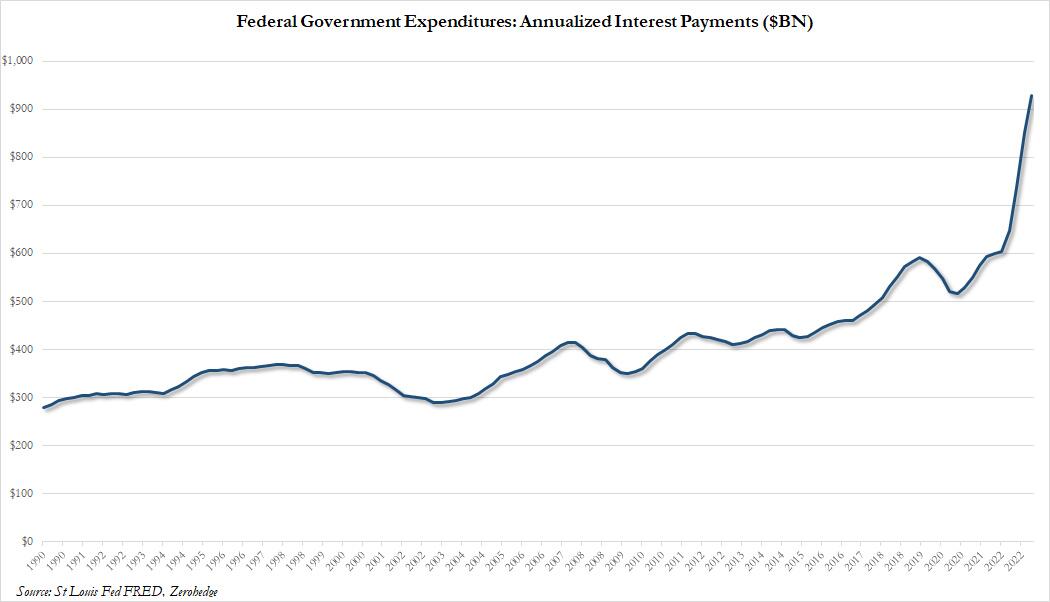
https://www.zerohedge.com/markets/something-very-strange-has-happened-albert-edwards-stunned-maddest-macro-chart-i-have-seenTwo weeks ago, we showed that as interest rates inexorably keep rising ever higher as the Fed's crusade to tame inflation (which the Fed unleashed three years ago) reaches a crescendo, arguably the most significant consequence of this relentless creep higher in rates is that the annual payment on US Federal debt is about to hit $1 trillion, surpassing how much the US pays every year on defense!
Yet while the motley composition of US federal debt - which ranges from a few days for T-Bills to 30 Years for Bonds - means that the impact of higher rates is relatively quick to pass through to actual interest payment cash outflows, other debt portfolios have far better insulation from the most aggressive Fed tightening cycle since Volcker, which while superficially beneficial to the issuer, could have profoundly adverse impacts for the broader economy as the Fed is forced to keep rates far higher for much longer, which crushes ordinary retail borrowers who, unlike most corporations, didn't have the ability to issue debt maturing many years from now back in 2020 and 2021 when rates hit record lows.
This brings us to what SocGen's Albert Edwards has dubbed the "maddest macro chart I have seen for many years."
In his latest Global Strategy Weekly note, the SocGen permabear turns "to the strangest chart I have seen for a very long time, or rather a series of charts." This is how he frames it.
The federal government spending has gone up a lot despite the Fed's attempt to control inflation.
And here is the maddest macro chart in question:
As Edwards elaborates, he was "so surprised when I saw Jitesh’s chart (above), I assumed it was a mistake and emailed the SG macro-network for help. No, the chart is correct. The data comes from the BEA GDP press release (table 11 line 9). Raw net interest payments in $bn are shown as the red line below."
The next chart leads the SocGen skeptic to conclude that "something very strange has happened, and it helps explain the recession’s tardy."
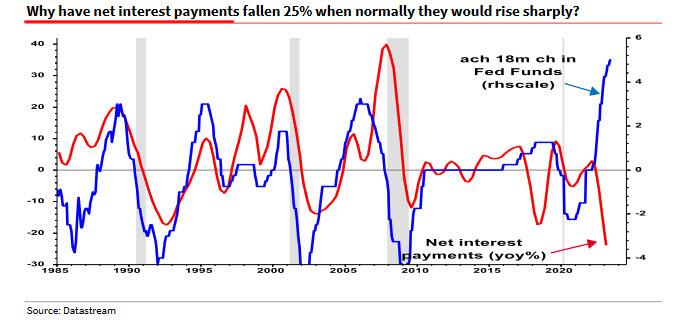
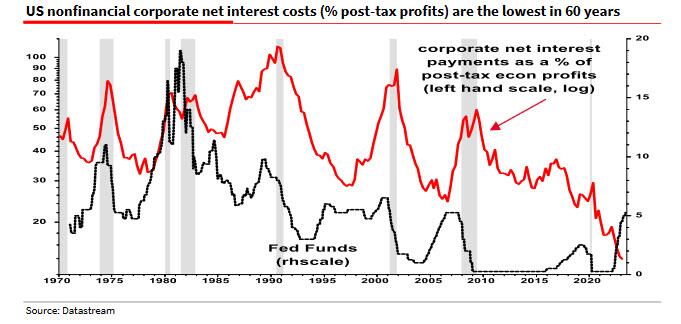
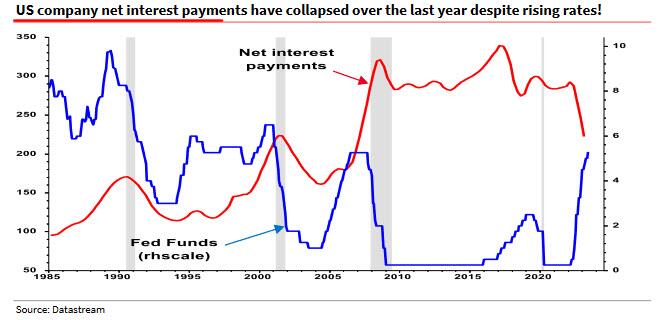
So what has happened? Well, as Edwards concludes, a sizeable proportion of the "huge, fixed rate borrowings during 2020/21 still survives on company balance sheets in variable rate deposits (see Z1 table L103)" meaning that corporations continue to benefit from locking in the ultra low rates of 2020 and 2021 even as their cash interest income are soaring. Indeed, as the SocGen strategist adds, "companies have effectively played the yield curve in reverse and become net beneficiaries of higher rates, adding 5% to profits over the last year instead of deducting 10%+ from profits as usual (chart below)."
The reason recession is slow to come is because of fixed rating borrowings from 2020 to 2021 and are on balance sheets. They continue to benefit as rates are locked in. The interest rates have done little to decrease inflation.


